Warp-speeding the captain of the Starfleet
Have you ever heard of MusicBrainz Picard? It is an amazing piece of software that makes tagging music files a breeze. Not only that, but it can also be used to fingerprint your music files, identify the recording and pull up metadata from the MusicBrainz servers.
I got some spare time earlier this year and decided to tag my long-abandoned music library. Started by downloading the latest version of Picard, then installed it. After that I executed the binary and finally clicked to scan my library folder.
And then I waited… And waited… And waited… Jesus, what is this thing doing? It was barely touching the disk drive, but the single thread was pinned at 100% load. It clearly had a bottleneck somewhere and I had to find it. Started looking into the code that performed the load and the profilers quickly indicated troublesome spots, which I thought could be spread into multiple processes to speed things up. Spent some time trying to make it work and failed miserably due to circular dependencies between the logic components and the GUI.
Then I tried looking in the forums because I must be doing something wrong. I have found a few people complaining about performance. After that, I dug their issue tracker and hit gold. Issue 975 - Reimplement the threading code in Picard.
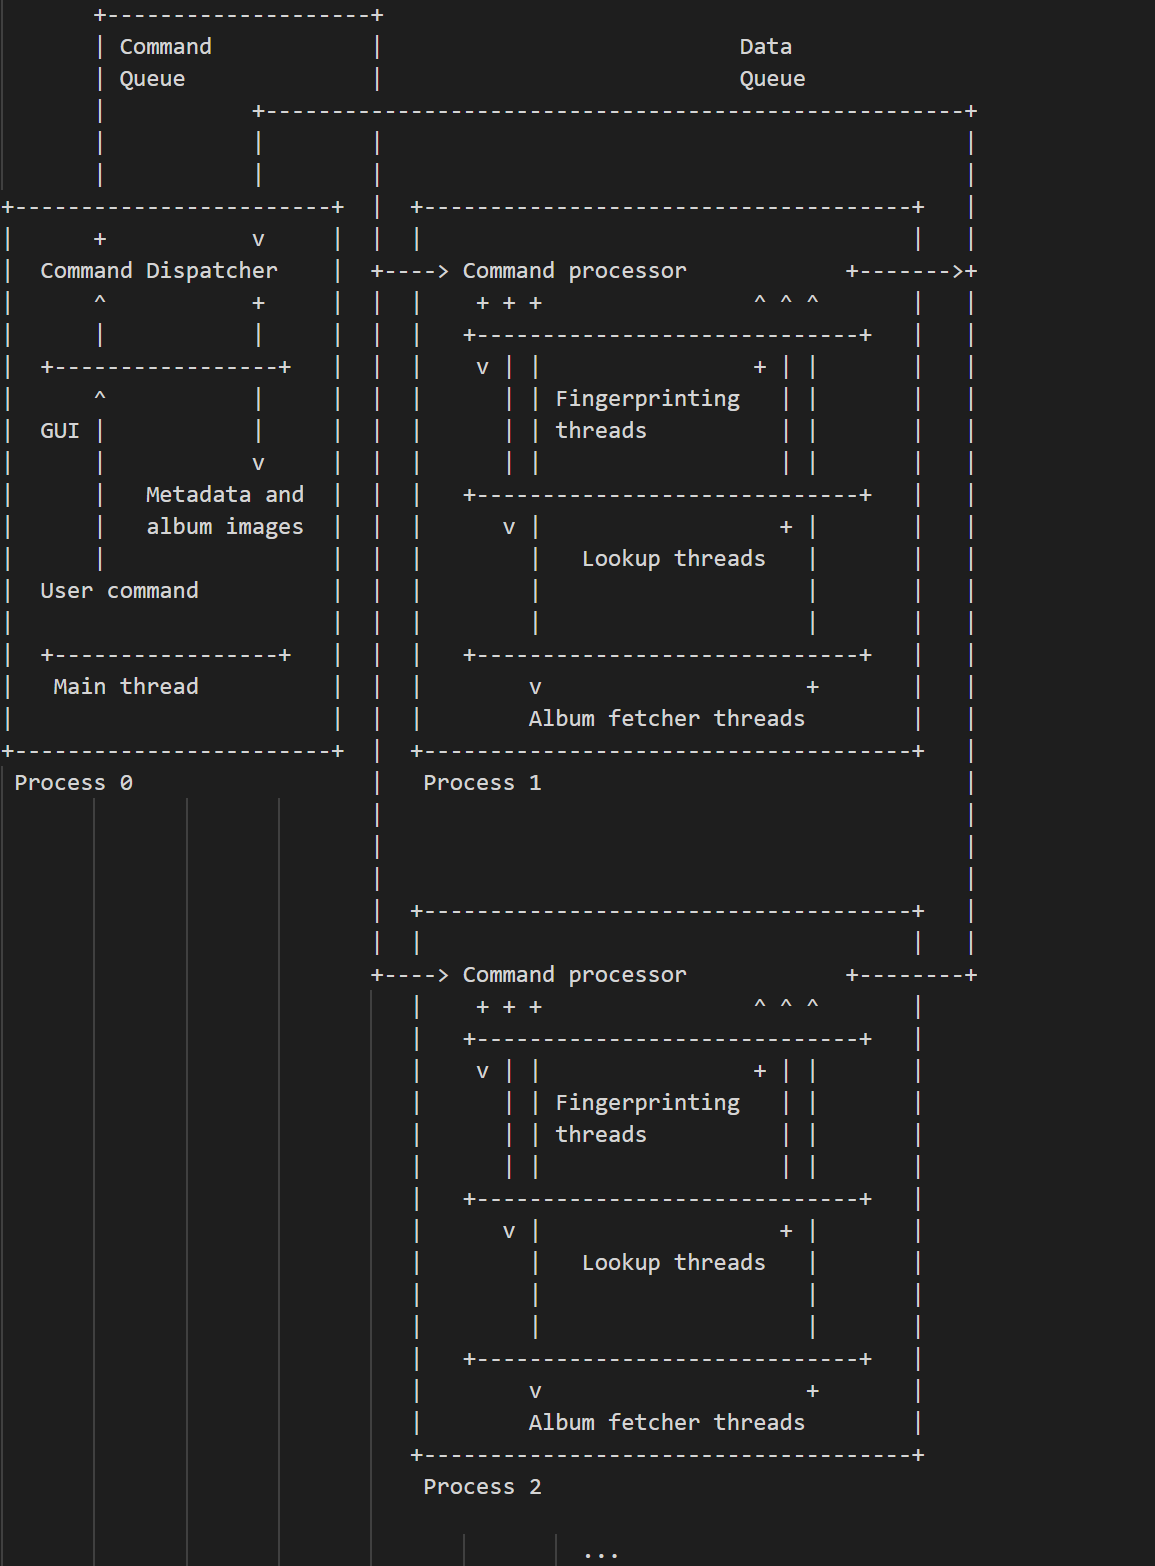
One of Picard’s contributors, Sophist gave me a few hints where to look at. After assuming the bottleneck was CPU-bound, I’ve proposed a multi-process architecture. It ended up being a dumb way to deal with the issue, but we will come to that later.
We then discussed a bit and I started looking into the areas suggested by Sophist. I decided that batch processing would probably speed things up, as instructions/data would be cached. I was partially correct, and managed to reduce load times from 20 minutes down to 8 minutes. It was huge. Got pretty excited with the results and decided to properly profile things.
And then we hit the first major breakthrough:
1 - When the slow path is too slow, having a fast path is a good idea
The cProfiler indicated that most of the remaining time during load was due to trying to guess the file format based on file headers instead of using the file extension. It so happens that most of the time the files extensions are correct, and we could skip trying to identify the file. If the load failed, we could fallback to trying to guess the file format. That alone reduced load times even further, from 20 minutes down to 3.5 minutes. It became my first pull request for Picard. Pretty exciting.
After that, I tried a bunch more stuff to make things faster, but nothing seemed to change. Then I started looking at the IO performance. Mainstream Picard barely reached 3MBps while reading the files. The batch version was much faster, reaching up to 39MBps, but it also prevented the UI from updating, causing freezes.
There was definitely something messed up, and thread starvation seemed to make sense. It so happens that the directory scanning thread, that fed file loading threads, was executed concurrently instead of running at once and then dispatching the work. That made Picard randomly access the disk while trying to load songs at the same time it scanned directories. A.k.a. the worst-case scenario for HDDs.
By scanning first and processing later, we drastically reduced thread wait times.
And then we hit the second major breakthrough:
2 - Poor loading threads were starving to death while scanning thread was trying to keep up
Improving the scanning thread and letting it completely scan the directories before dispatching work for other threads was essential to boost performance. This change alone reduced loading times of a different library from 32 minutes down to 13 minutes, as reported in my second pull request.
We ended up moving discussion from their issue tracker to that previous pull request thread. The IO issues seemed to be solved, but now it was the UI that could not keep up with the file loading, causing freezes and stutters. This is where things turned out way more difficult to profile than I initially expected.
Tried some really complicated stuff, like caching metadata to skip reloading files and part of the multi-process architecture.
Profilers pointed at different things all the time: first updating the file items, then the file loading finalization, then the sorting algorithm, and finally the sorting of the panels.
Surprisingly, temporarily disabling the sorting of the panels was super effective, and our third breakthrough.
3 - Sorting over and over an ever-increasing list is insane and UI draws are super expensive
We disabled the sorting during operations that involve moving/adding/removing large amounts of files (e.g. loading/clustering). This reduced drawing times of the items in the panel from 30 minutes down to 1 minute.
It was at this point I realized the previous changes were way too much and we could achieve basically the same great results with fewer changes. Remember when I said the multi-process solution was dumb? This is the point I realized it was the case.
Putting the previous 2 breakthroughs into a single PR, we manage to reduce loading times of a third library from 50m down to 6m. At the same time, clustering times fell from 5h17min down to 3 minutes.
But I was not done just yet. I could feel the profilers were messing with me. How could I have changed a ton of stuff, and instead of processing times falling they would just move around to different functions? Quite puzzling.
The answer was the profilers just could not measure the problem because it was not in python, but outside python. What do I mean by that? The C libraries that took the GIL and blocked python were the culprits. I decided to move some of the modules to cython to track exactly where the calls were made and voilà. Two missing Qt size hints were two large contributors to the UI slowdown.
Our fourth breakthrough:
4 - Qt documentation is poor, and profiling mixed language software is nightmarish
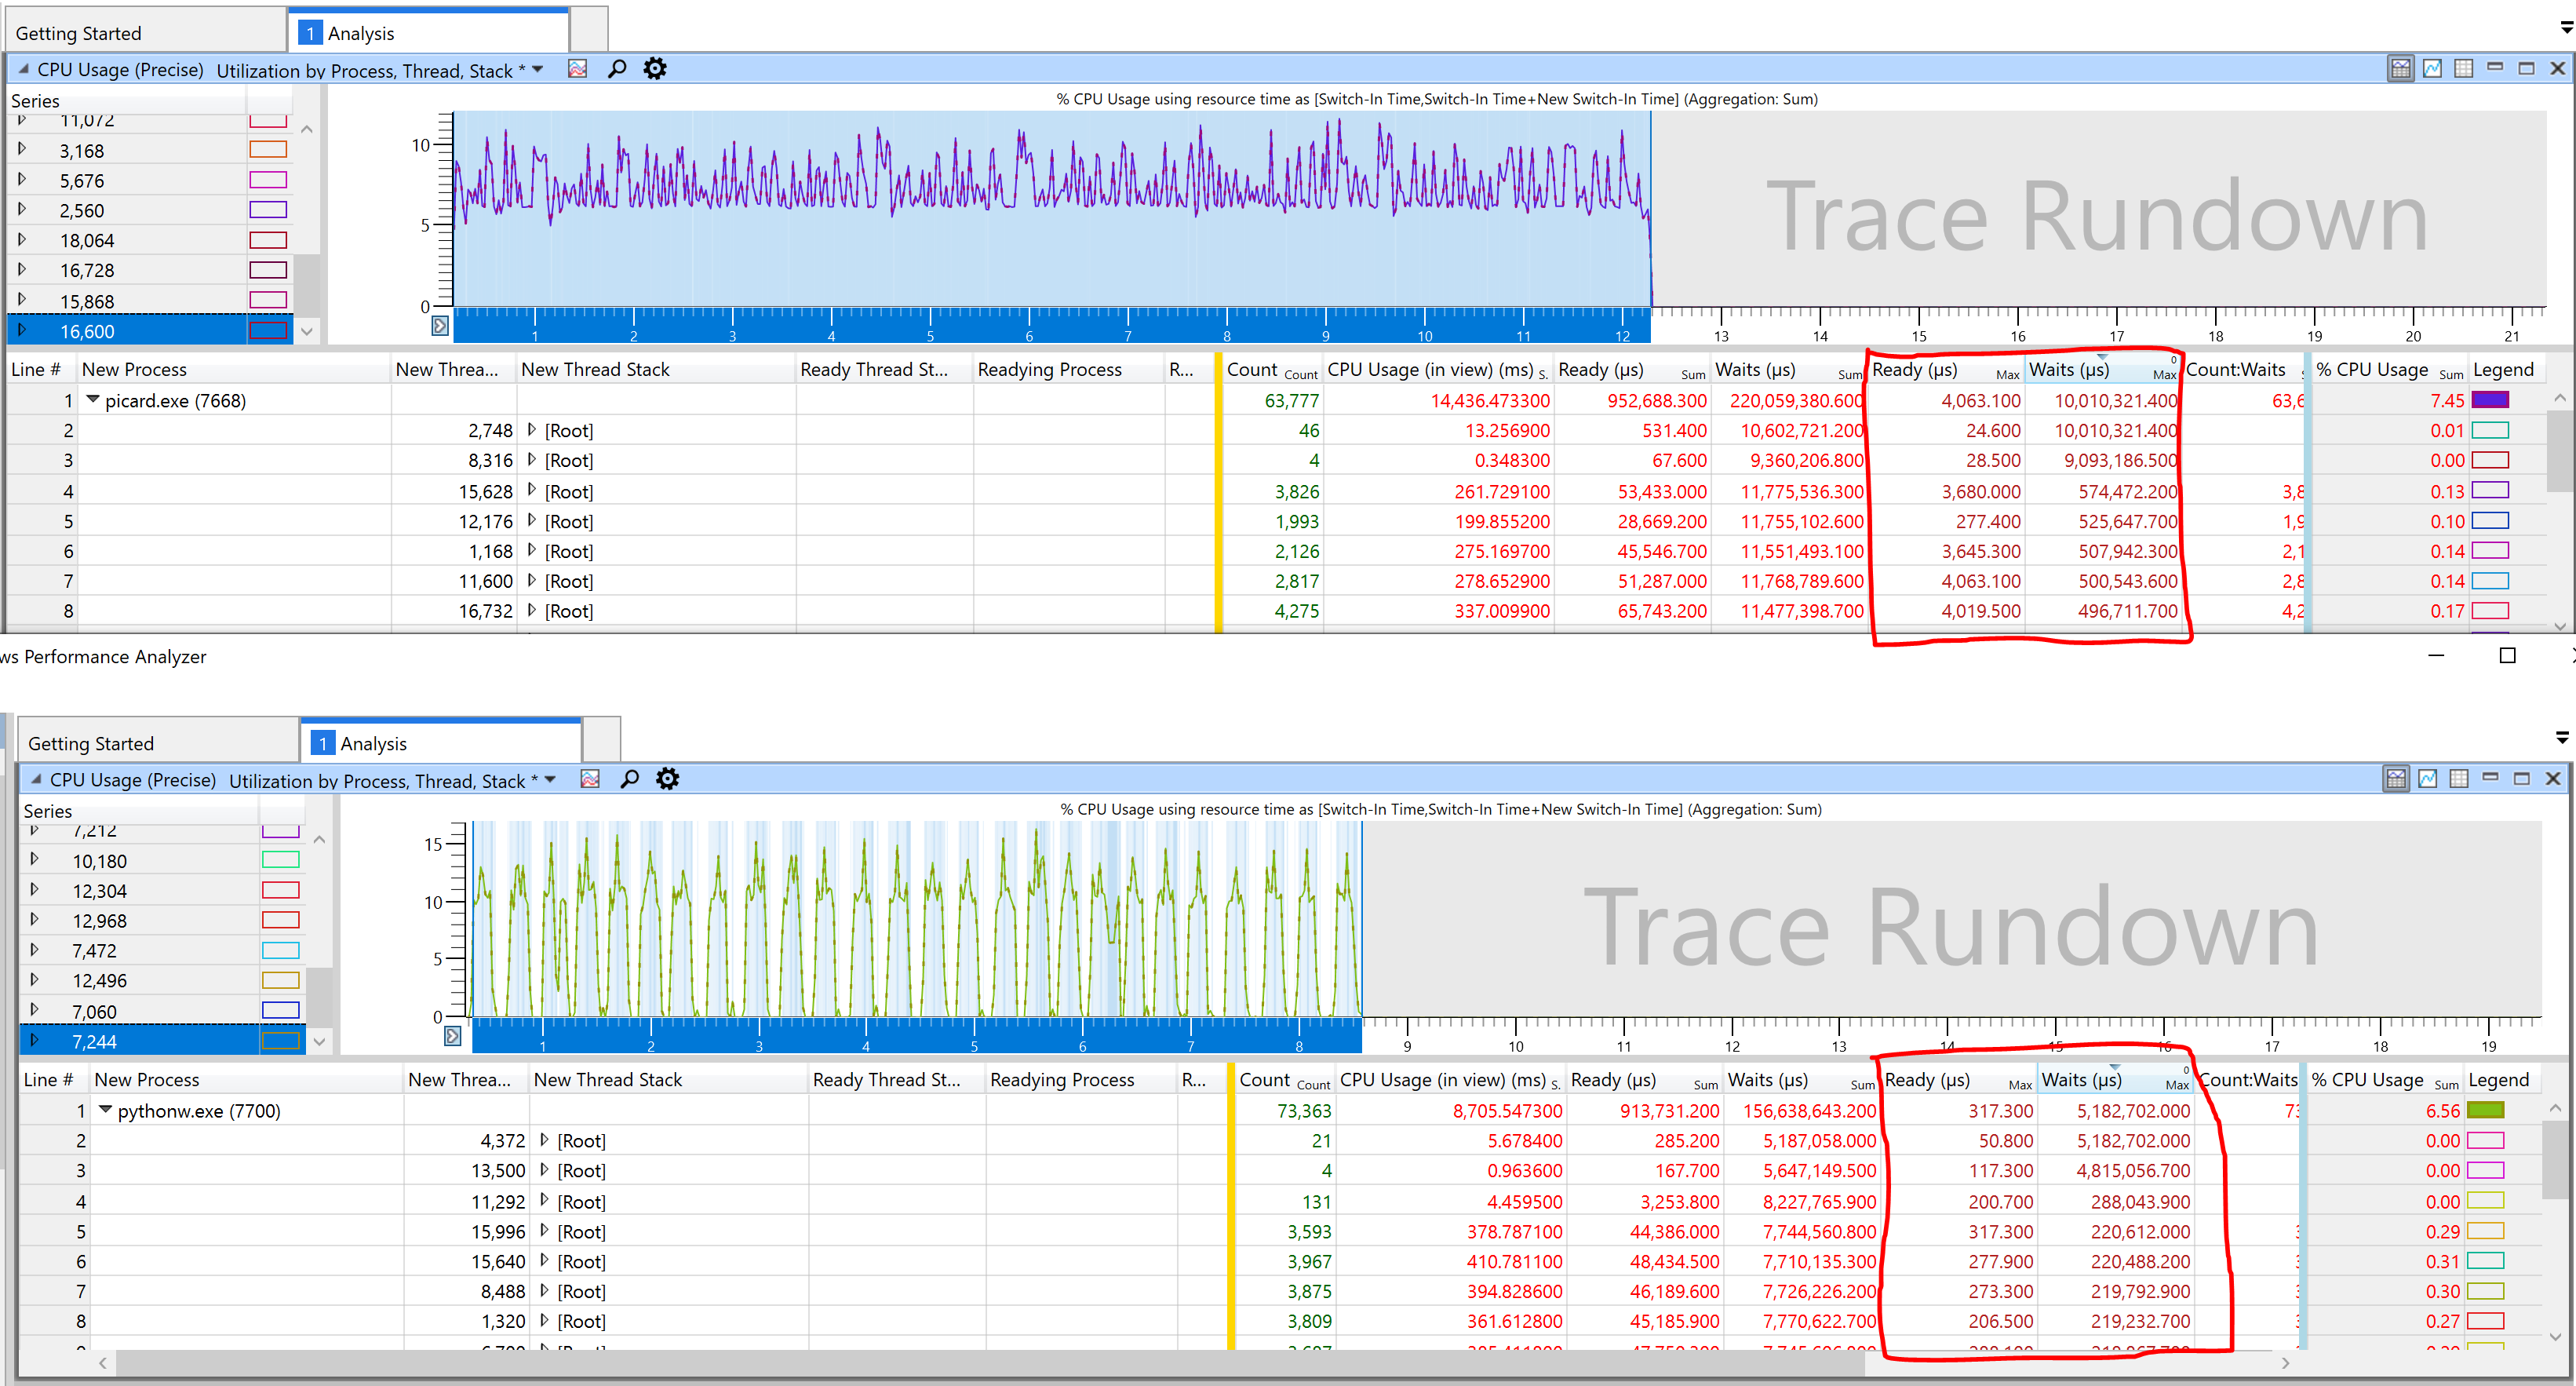
Yes, two Qt size hints were enough to improve the UI responsiveness by a huge margin. Those were two one-liners but reduced the CPU samples from 40% down to 10% of total samples. This means Picard can actually do useful stuff instead of guessing sizes during repaints of the UI.
Without hints = 40% of CPU samples 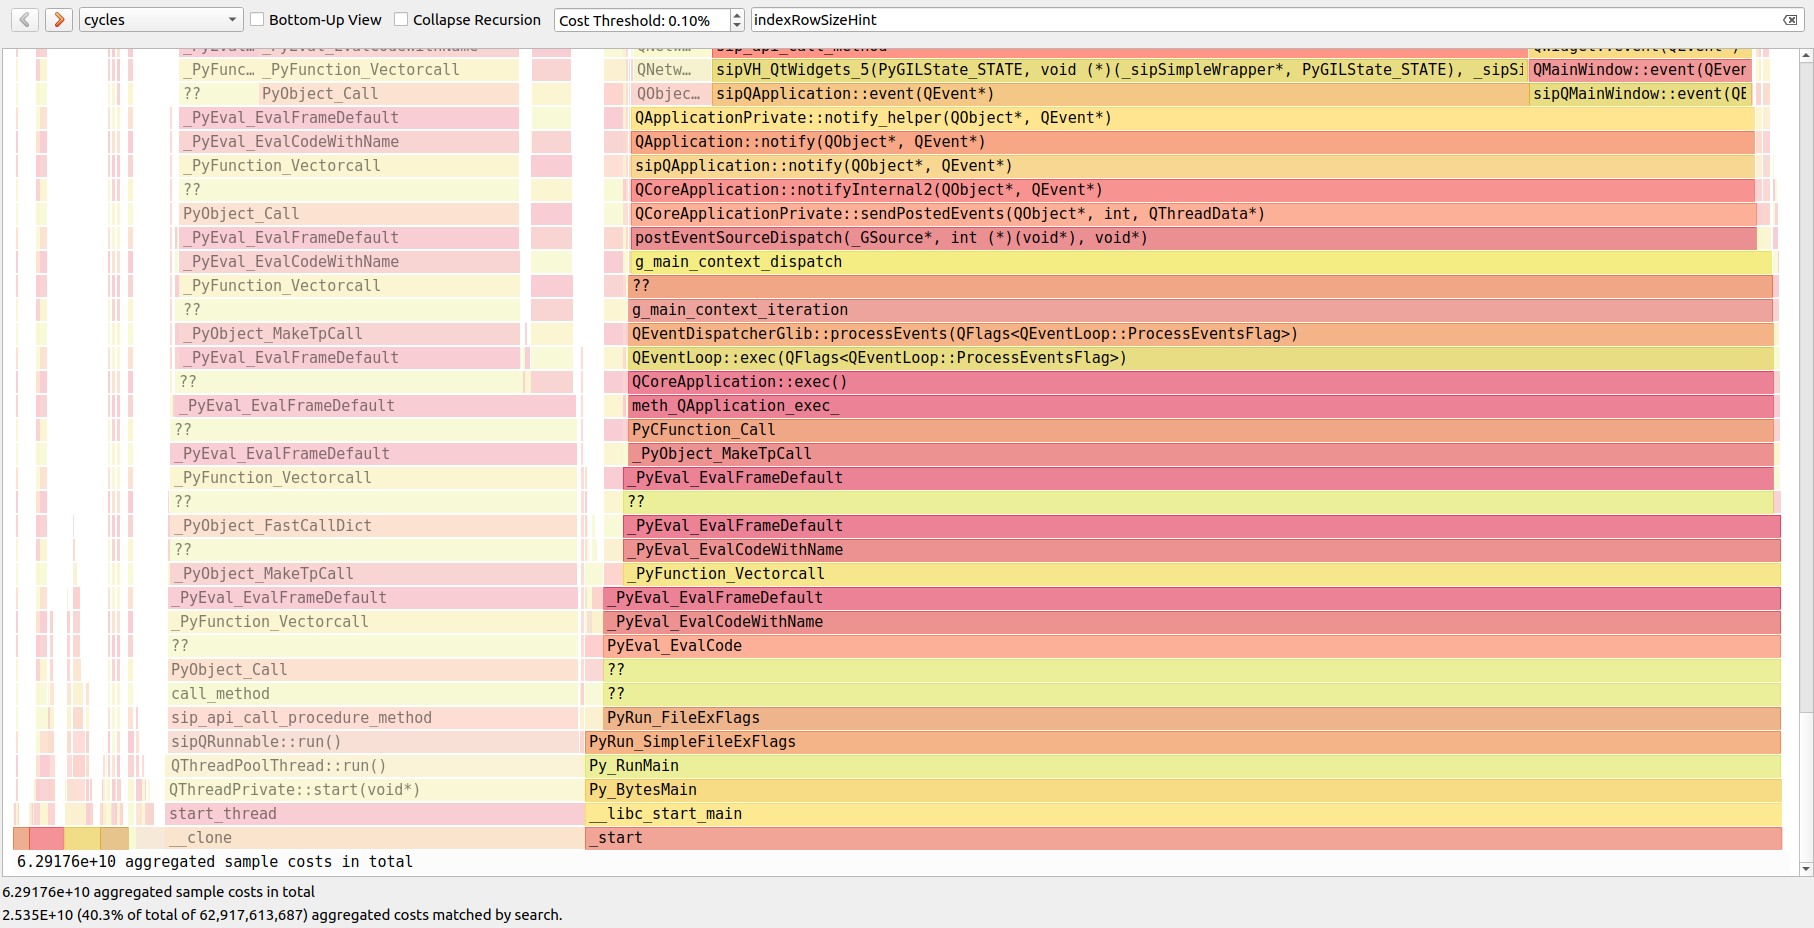
With hints = 10% of CPU samples 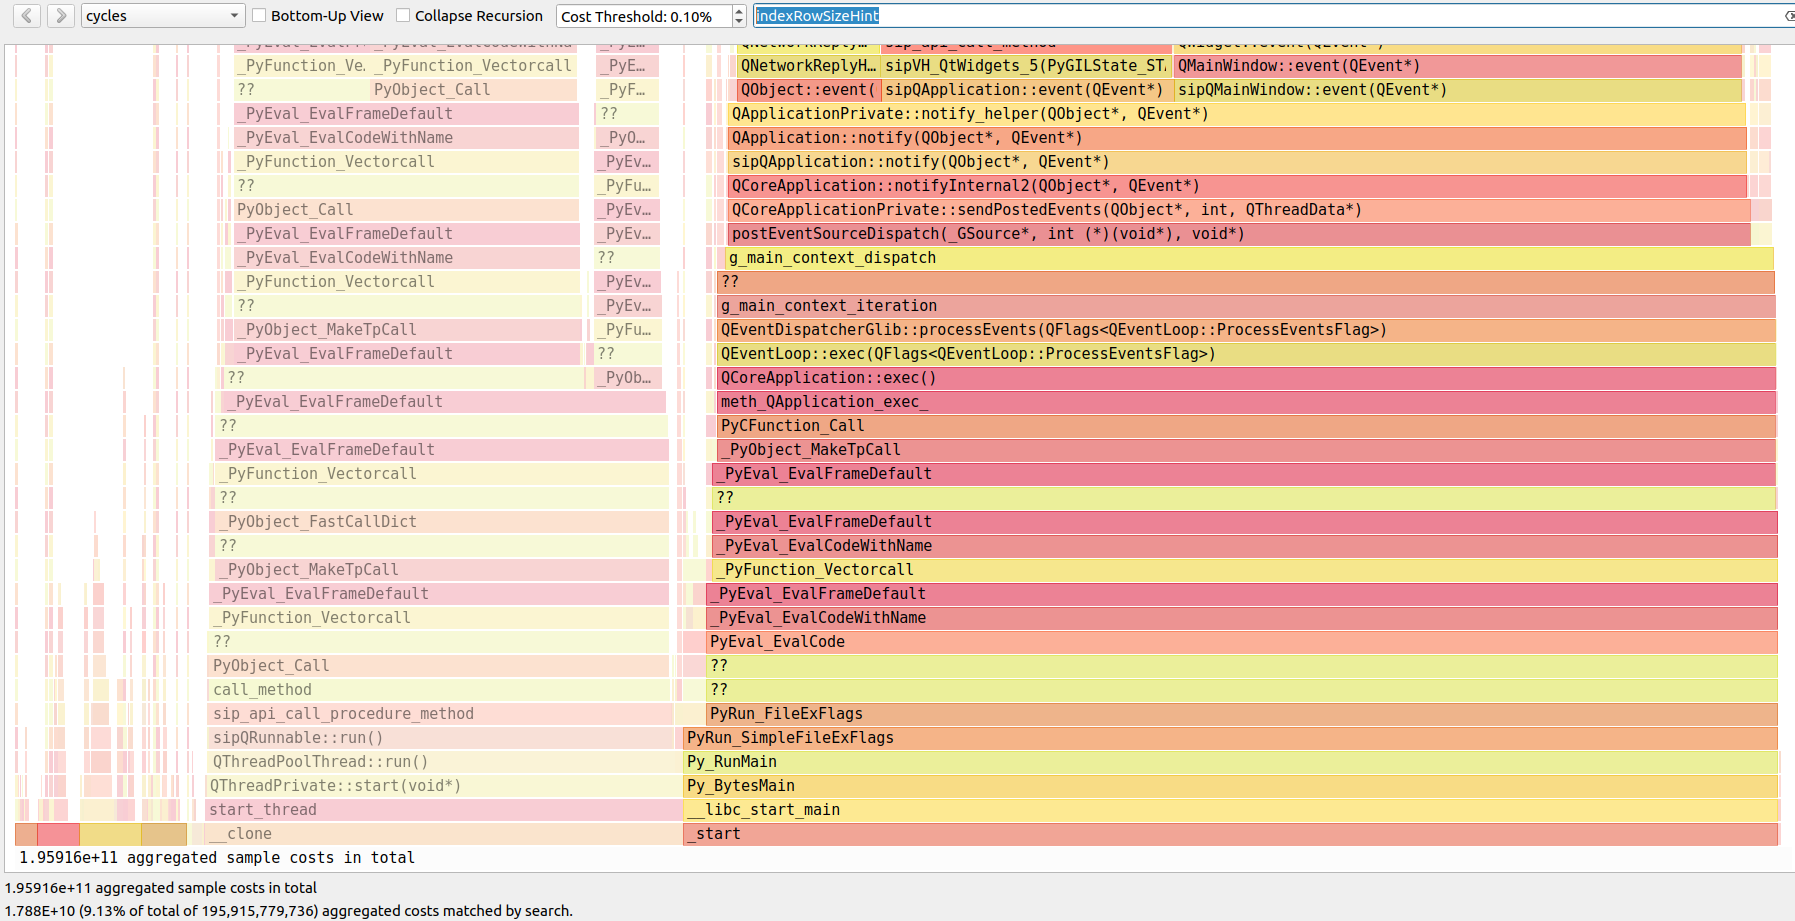
Side effects? 150x speedup on moving files during clustering with expanded clusters (worst case scenario) + sorting disabled. People used to recommend collapsing the clusters to speed things up, but it got solved by two one-line hints. Completely crazy.
With this, I was pretty much done, but the UI still had some freezing/hiccup issues, especially in Windows. After further profiling, I have noticed the worker threads had a lot of contention while checking configuration variables. They spent a ton of time waiting for each other due to locks. To prevent them from locking, we only locked the reader threads if the cached setting was marked as stale/dirty or when a thread needed the lock to update the setting. This was done in this commit.
Other area of Picard that drastically slowed things down was selecting tracks. They updated the metadata box, which can be awfully expensive depending on how many items are selected. I tried to mitigate the issue here, by preventing metadata box updates if the selection didn’t change. It seemed very logical to me (as I am trying to prevent reprocessing everything), but it ended up causing issues to other users. Tried a few more changes later, but it still ended up being changed as users reported other issues… My bad.
End results
As reported in ticket PICARD-1844 - Further improve loading and clustering performance, loading times fell from 50m down to 5m30s (~9x speedup), and clustering times fell from 5h to 2m (~150x speedup) in my library with 19k files. UI responsiveness is way harder to measure, so no hard measures on that, but you can try it by yourself. Touching mere 700 lines of code instead of rearchitecting the entire thing as I initially thought would be necessary… Changes were released in Picard 2.4.
It was pretty fun and the results were great. Laurent (Zas), Philipp (outsidecontext) and Sophist (I don’t know his real name) were awesome and helped a lot.