5G-RANGE
The goal of the 5G-RANGE project is to design, develop, implement and validate the mechanisms to enable the 5G network to provide an economically effective solution for Internet access for remote areas.
In terms of simulations, our goal was to implement the channel model of the 5G-RANGE project, validate the results based on the field trials measurements, provide dynamic spectrum access capabilities that enable opportunistic use of the spectrum underutilized by TV white spaces.
How do you get it?
Following instructions in COLAB-5G.
An example of a setup using it is available here.
What have we done so far in terms of system-level simulations?
We used the LTE/LENA model of the ns-3 simulator as the basis for our project. The original code follows the 3GPP LTE specifications really closely, providing a solid foundation for mobile networks development.
[x] = complete [ ] = pending
List of changes associated with the channel model changes
- Implement a simple propagation model for 5G-RANGE large scale path loss (named RANGE5G in the propagation module, following the path loss equation described in D3.1)
- Implement the detailed propagation model with fast fading for large and small scale path loss (CDL D/LOS and CDL A/NLOS)
- Implementation of spatially correlated shadowing for the 5G-RANGE channel models
- Validation of the channel model implementation
List of changes associated with the physical layer
- Implement spectrum sensing on the UEs (using probability of detection tables)
- Implement hooks to notify the MAC layer of the detection
- Widen channels to workaround the lack of cross-carrier aggregation
- Implement a new error model for 5G-RANGE CDL D and A channels
- - Implement numerology support and feed speed between nodes into the TBLER calculation
- - Load and interpolate new BLER curves according to the channel type (CDL D/LOS or A/NLOS)
- - Take into account CBs SINR to fetch the proper error rates and assemble the correct TBLER
- Load and interpolate new MCS scheme and spectral efficiency curves
- Validation of the physical layer implementation
List of changes associated with the MAC layer
- Adapt the existing code to behave properly with new MCS values
- Adapt the existing code to support higher granularity scheduling
- Implement a simple cognitive MAC protocol
- Implement sensing messages and proper transmission time
- Implement sensing messages reception on the eNB
- Implement collaborative sensing algorithm to merge received information
- Implement translation from the compiled sensing information into a mask of occupied RBs/channels
- Implement changes to mark the free slots list as occupied based on the mask of occupied RBs
- Implement changes to the resource schedulers to take into account the quality of aggregated carriers (be it cross-carrier or LAA)
- Implement collaborative spectrum sensing and performance metrics collection
List of changes associated with the network layer
- Increase buffer sizes to improve 5G-RANGE performance
List of changes associated with the application layer
- Custom application to inject traffic with known distributions to analyze the impact of changes to lower layers
- Custom traffic generator EROS
How about some results and nice pictures?
Sure. Here are some of them.
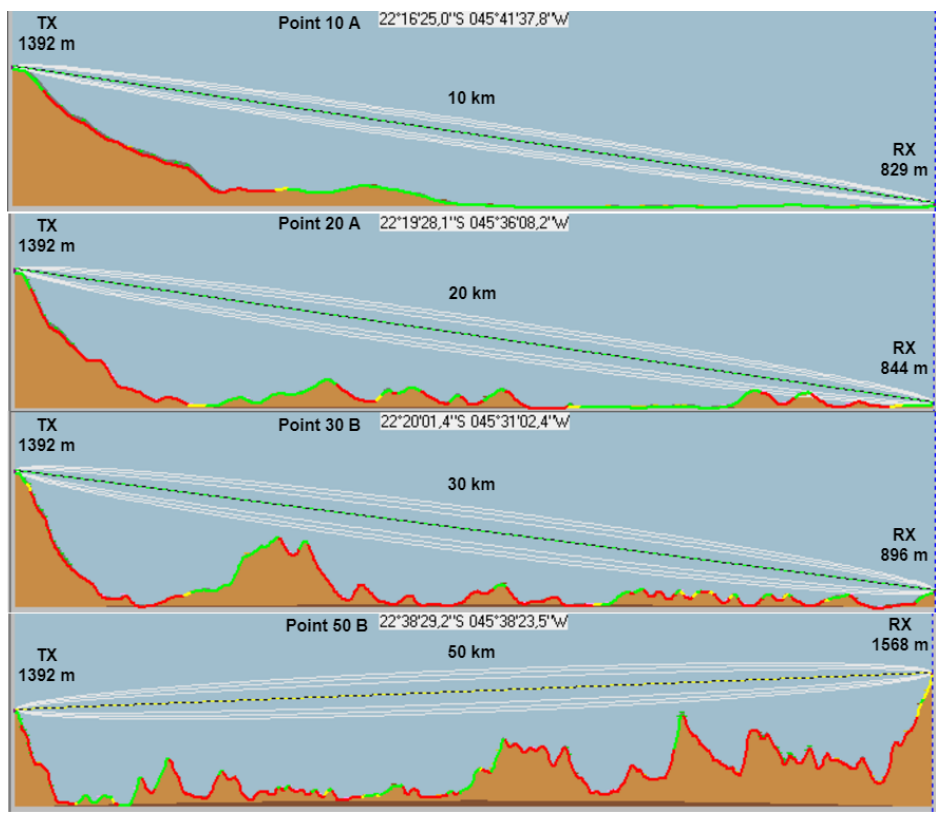
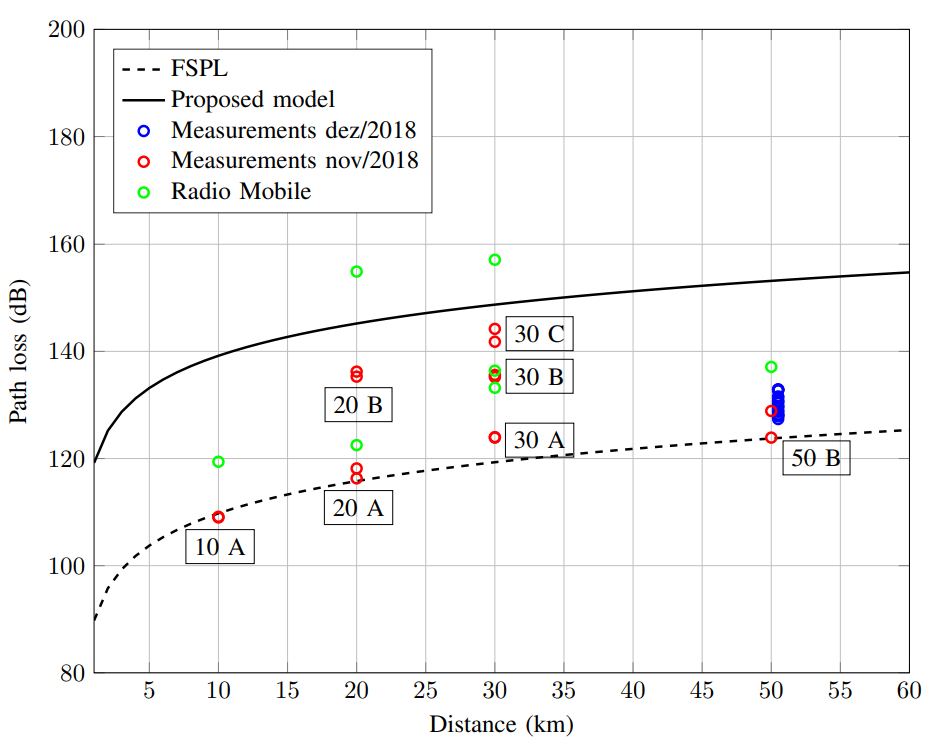
Field trial measurements
The field trial was executed by the Inatel and the Federal University of Ceará (UFC) teams, and findings were published in 5G-RANGE Project Field Trial
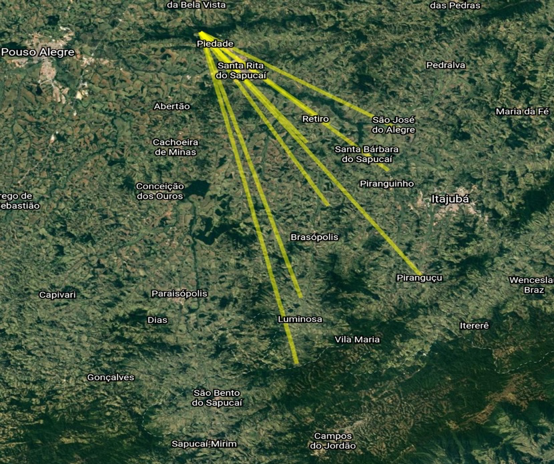
The following images are from the field trial paper mentioned above.
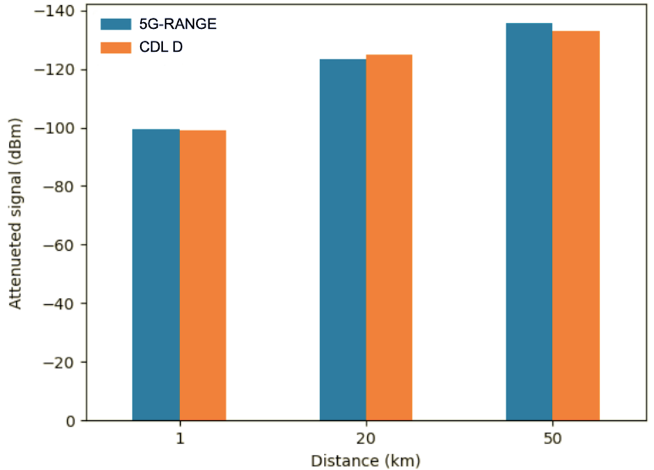
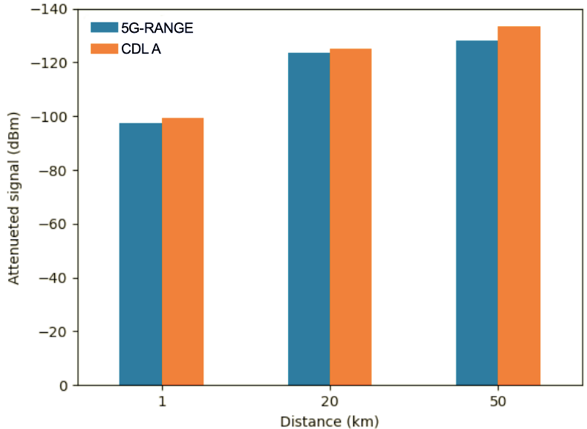
Channel validation
There were two channel models proposed based on CDL D and A, for LOS and NLOS scenarios, respectively.
The models were proposed by the UFC team and published in CDL-based Channel Model for 5G MIMO Systems in Remote Rural Areas.
Our implementation (5G-RANGE in the figures below) matches the expected results for both CDL D and CDL A.
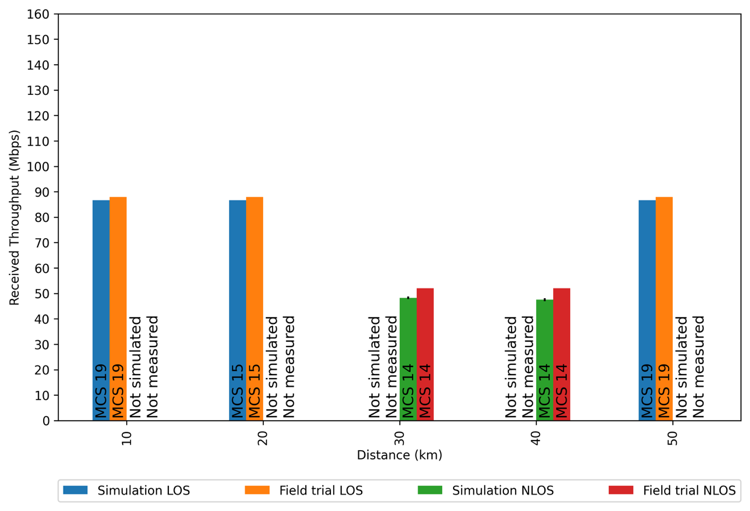
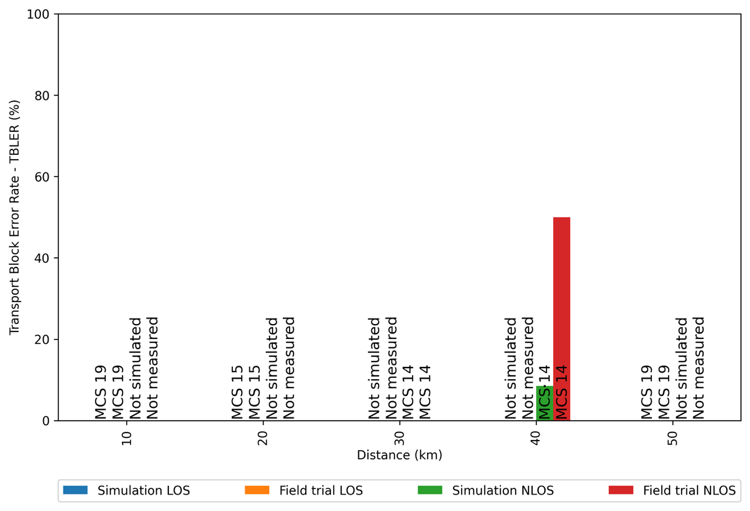
PHY and MAC validation
The PHY and MAC were validated comparing to the proof-of-concept measurements made in the field trials.
The simulated performance matched the real-life results from the trials.
The results for TBLER on the other hand, were a lot higher on the field trial measurements for NLOS at 40km.
Dynamic Spectrum Access with Collaborative Spectrum Sensing
This is my main contribution, and it was done in collaboration from our friends from the University of Oulu.
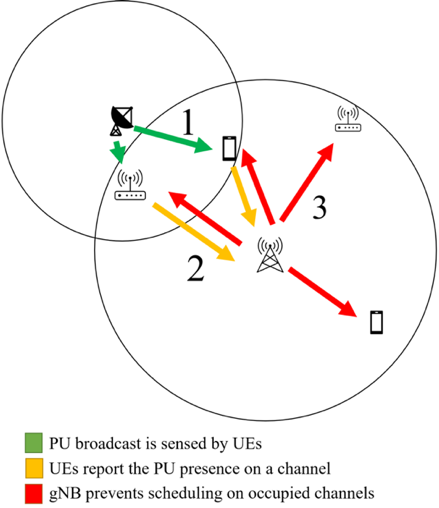
How can we detect a primary user (channel licensee)? There are many ways, but the one that doesn’t have to rely on a central entity giving out temporary licenses is basically some form of spectrum sensing.
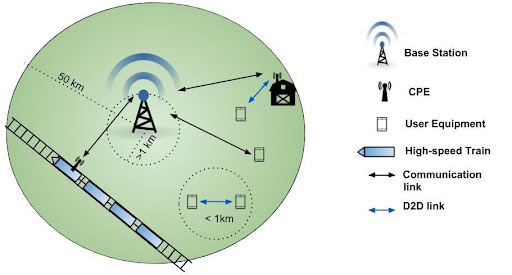
Since a single point sensing the spectrum in a 50km-wide cell isn’t very effective since the sensing element can be far enough of the licensee to perceive it is transmitting. If both transmit simultaneously, we cause interference, which is not desirable nor allowed.
Using collaborative spectrum sensing (CSS) is a lot more logical in this case. CSS allow multiple sensing elements to perform their sensing independently and merge/fuse their sensing results later.
In our case, the individual sensing technique used is based on the technique proposed on Spectrum window based signal detection at low SNR, known as WIBA.
The sensing results are then fused according to a fusion scheme/policy on the LTE’s eNodeB (which is very logical, since we are using a centralized network as the base for 5G-RANGE).
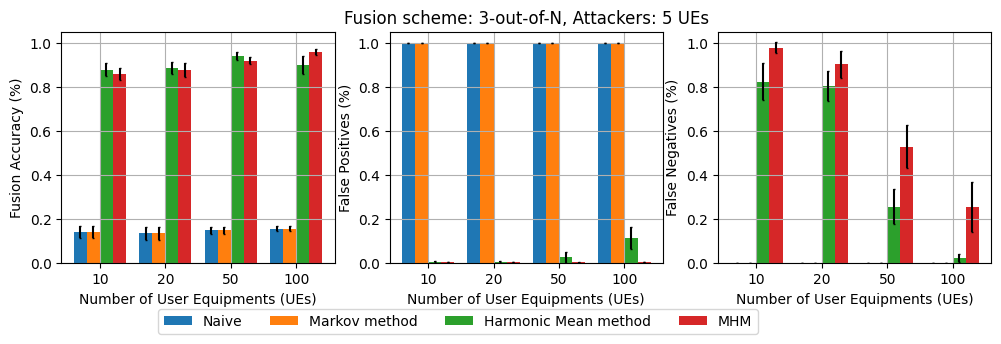
We have shown in MHM: A Novel Collaborative Spectrum Sensing Method based on Markov-chains and Harmonic Mean for 5G Networks, a particular combination of techniques to have an effective fusion scheme.
We used the BLER as a source of trust of the reported CQI by the UEs.
The trusted CQI can then be correlated with the sensing data: when a primary user starts transmitting, it is expected that nearby UEs have a drop in CQI. We can filter the others out by filtering by the harmonic mean of reported CQIs.
Building that trust makes us less exposed to Byzantine attackers (either malicious sensing reports or faulty ones).
We also employed a Markov Chain to make the individual sensing reports (sent on channel condition change) more stable temporally, saving up some control channel bandwidth at the cost of detection range.
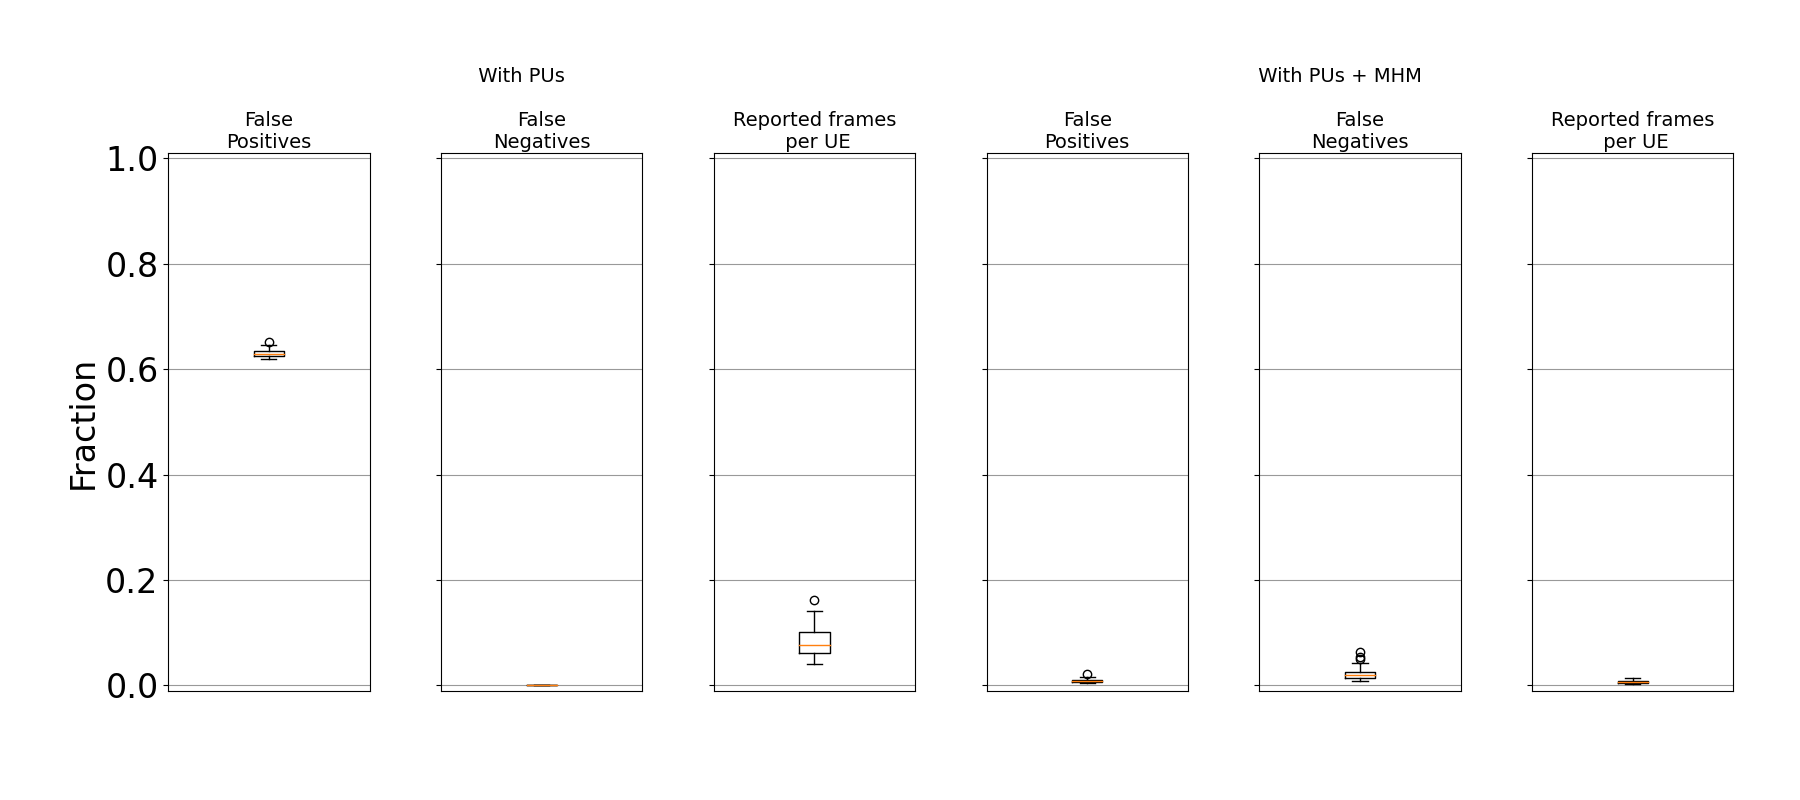
The images below show how false positives (a.k.a. unused spectrum), false negatives (a.k.a. interference with the primary user PU) and reported frames per UE (a.k.a. control channel overhead) scale with the number of UEs during different simulations.
With 20 UEs
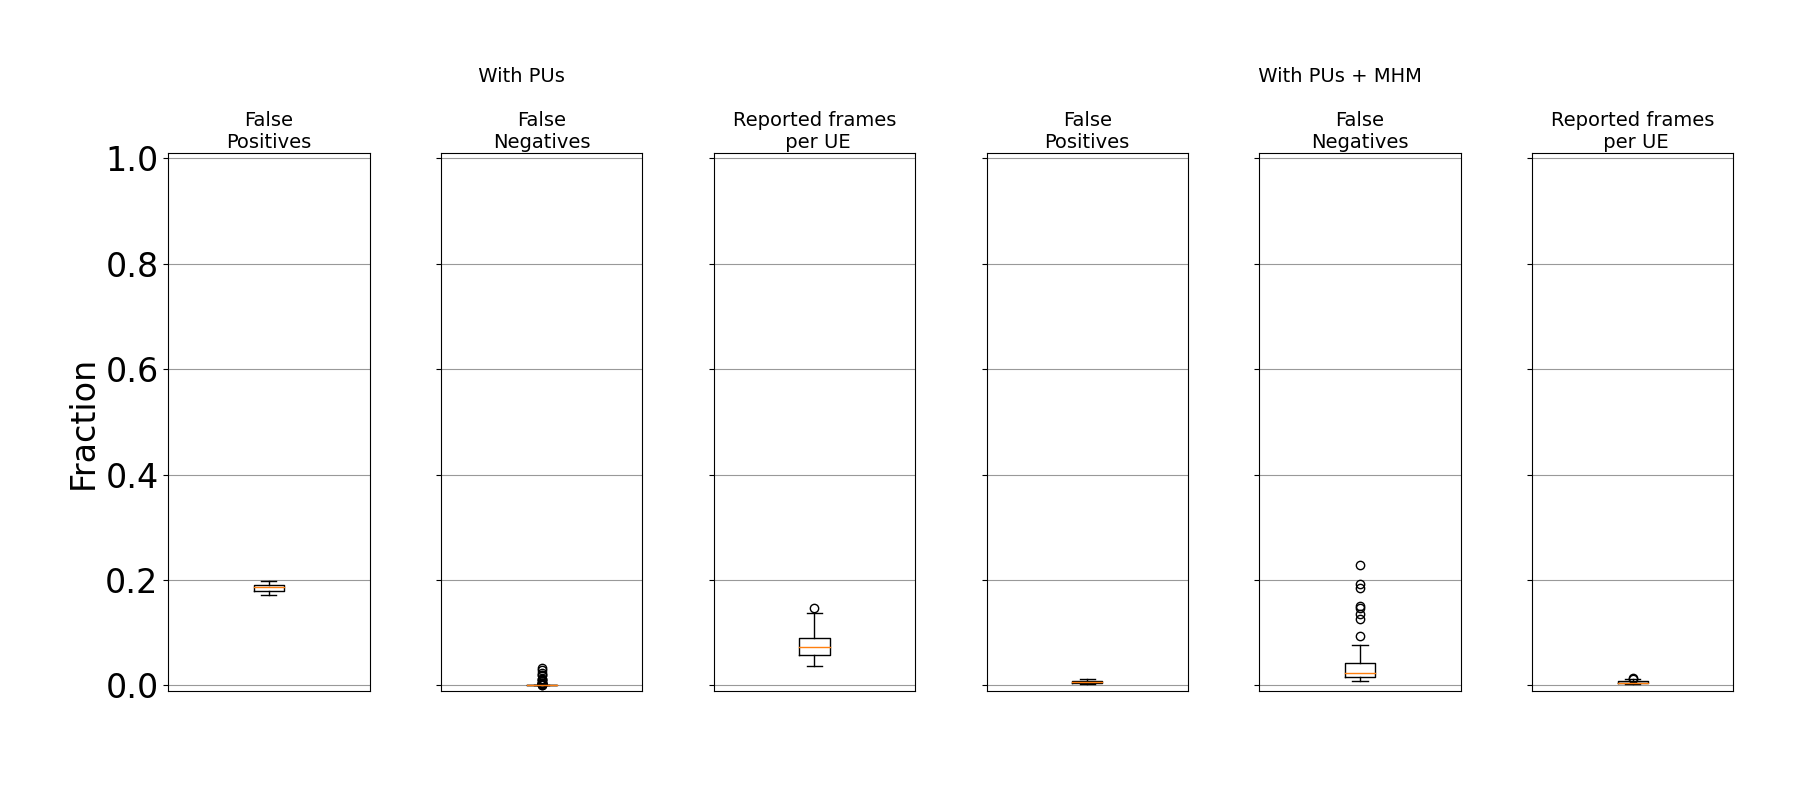
With 50 UEs
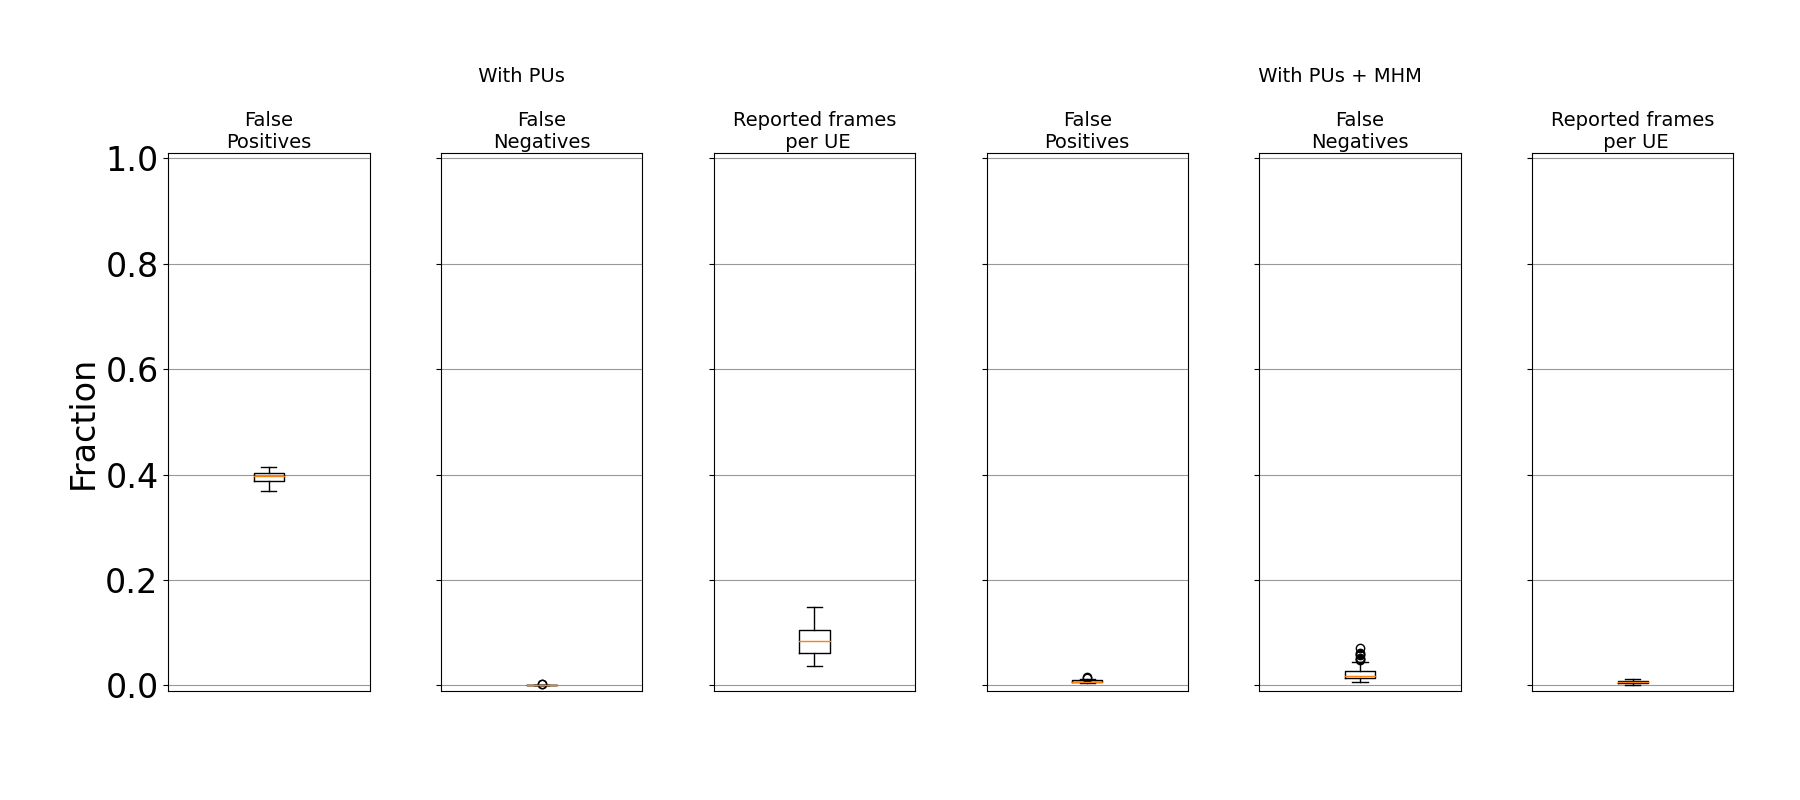
With 100 UEs
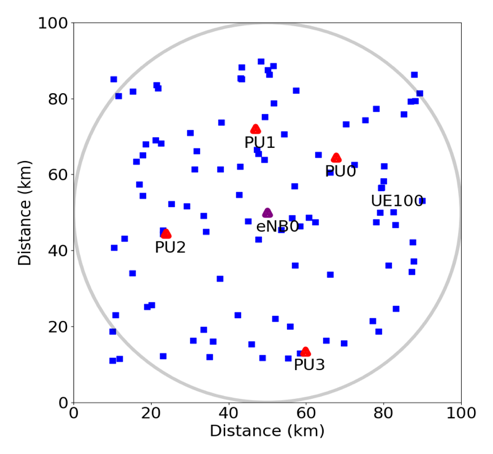
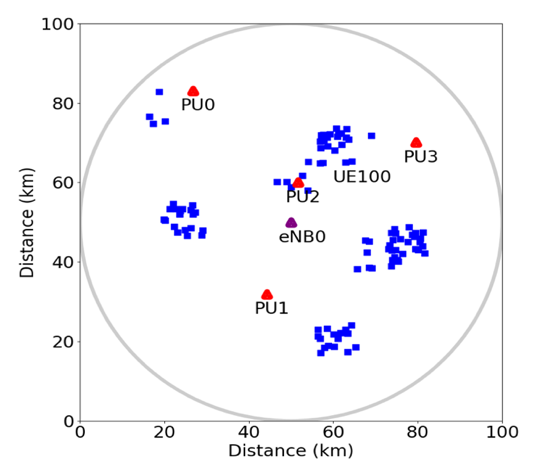
Of course, we simulated all of these in both scenarios with randomly dispersed UEs (less realistic) and scenarios with randomly dispersed clusters of UEs (e.g. rural businesses, small city, rural school, etc).
Randomly dispersed UEs
Randomly dispersed clusters of UEs
Acknowledgments
I want to thank every ns-3 developer, especially the CTTC people for the LTE/LENA model. It was essential for our project.
I’m also very grateful to all of our partners that enabled us to deliver an amazing simulation tool, that produces realistic results for our scenarios.
I’m very optimistic that our work will end up in the wild, providing network connectivity for remote areas in Brazil, Europe and others.
P.S.: This is not an official page for the project. Please look at the official 5G-RANGE page for more information.